From the graph, it is a straight line so, uniform motion. Because of impulse direction of velocity changes as can be seen from the slope of the graph. Initial velocity =22=1 m/s Final velocity =−22=−1 m/sPˉi=0.4 N−sPi=−0.4 N−sJ=Pi−Pi=−0.4−0.4=−0.8 N−s(J= impulse )∣J∣=0.8 N−s
The figure shows the position - time (x-t) graph of one-dimensional motion of a body of mass 0.4 ~kg. The magnitude of each impulse is JEE Main 2010…
JEE Main 2010 — Physics Mechanics
2010mcqmedium
The figure shows the position - time (x−t) graph of one-dimensional motion of a body of mass 0.4 kg. The magnitude of each impulse is 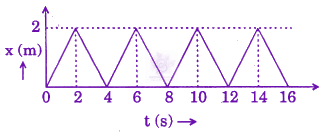
Official previous-year question
Held on 30 Apr 2010 · Verified 6 Jul 2026.
Options
- A
0.4Ns
- B
0.8Ns
- C
1.6Ns
- D
0.2Ns
Did you get this right?
Sign in to track your attempts and accuracy.
Your note
Sign in to keep a private note on this question. Nothing you write is ever public.
JEE Main Mechanics in other years
More JEE Main Mechanics questions
A small bob $A$ of mass $m$ is attached to a massless rigid rod of length 1 m pivoted at point $P$ and kept at an angle of $60^{\circ}$ with vertical as shown in figure. At distance of 1 m below point $P$, an identical bob $B$ is kept at rest on a smooth horizontal surface that extends to a circular track of radius $R$ as shown in figure. If bob $B$ just manages to complete the circular path of radius $R$ upto a point $Q$ after being hit elastically by $\operatorname{bob} A$, then radius $R$ is $\_\_\_\_$ m. 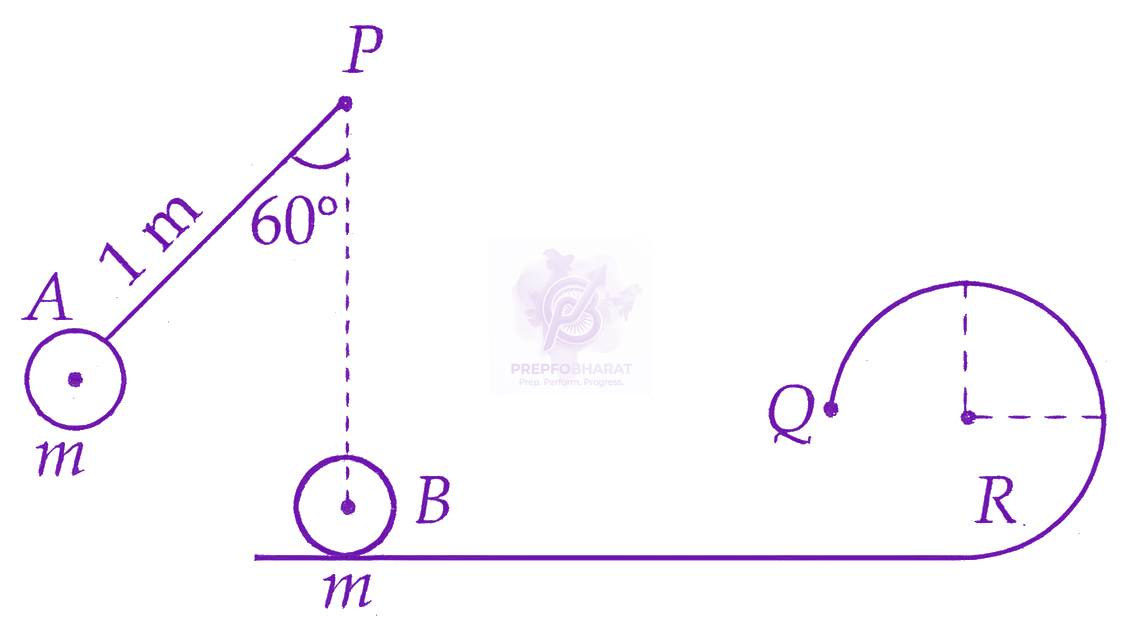
2026hard
In a screw gauge the zero of main scale reference line coincides with the fifth division of the circular scale when two studs are in contact. There are $100$ divisions in circular scale and pitch of screw gauge is $0.1$ mm. When diameter of a sphere is measured, the reading of main scale is $5$ mm and $50^{\text{th}}$ division of circular scale coincides with the reference line of main scale. The diameter of sphere is _______ mm.
2026medium
Two masses $m$ and 2 m are connected by a light string going over a pulley (disc) of mass 30 m with radius $r=0.1 \mathrm{~m}$. The pulley is mounted in a vertical plane and it is free to rotate about its axis. The 2 m mass is released from rest and its speed when it has descended through a height of 3.6 m is $\_\_\_\_$ $\mathrm{m} / \mathrm{s}$. (Assume string does not slip and $\mathrm{g}=10 \mathrm{~m} / \mathrm{s}^{2}$)
2026medium
Water flows through a horizontal tube as shown in the figure. The difference in height between the water columns in vertical tubes is 5 cm and the area of cross-sections at $A$ and $B$ are $6 \mathrm{~cm}^{2}$ and $3 \mathrm{~cm}^{2}$ respectively. The rate of flow will be $\_\_\_\_$ $\mathrm{cm}^{3} / \mathrm{s}$. (take $g=10 \mathrm{~m} / \mathrm{s}^{2}$) 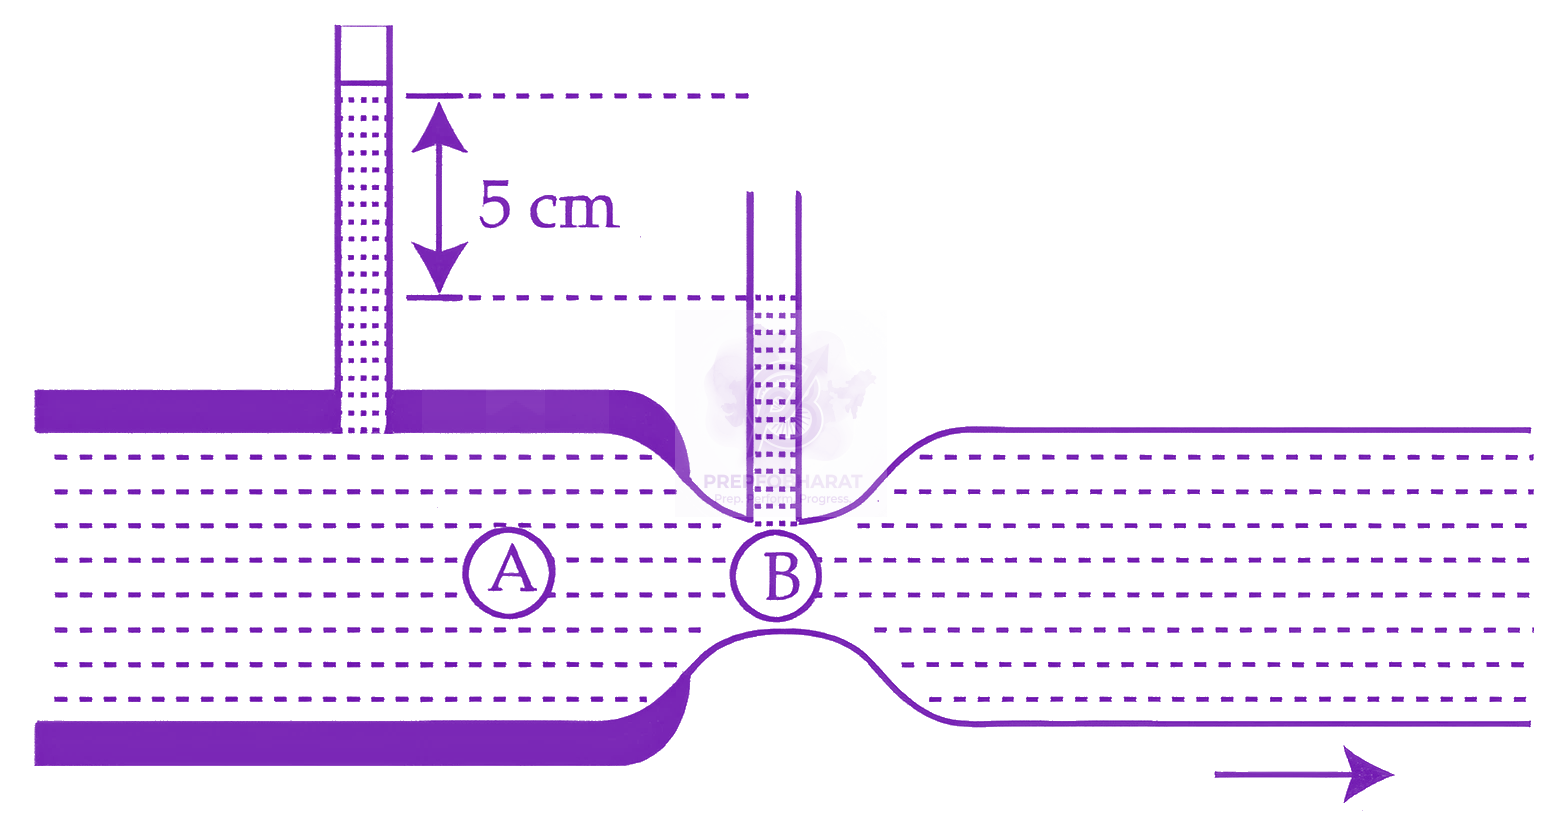
2026medium
Two circular discs of radius each 10 cm are joined at their centres by a rod of length 30 cm and mass 600 gm as shown in figure. If the mass of each disc is 600 gm and applied torque between two discs is $43 \times 10^{5}$ dyne. cm, the angular acceleration of the discs about the given axis $A B$ is $\_\_\_\_$ $\mathrm{rad} / \mathrm{s}^{2}$. 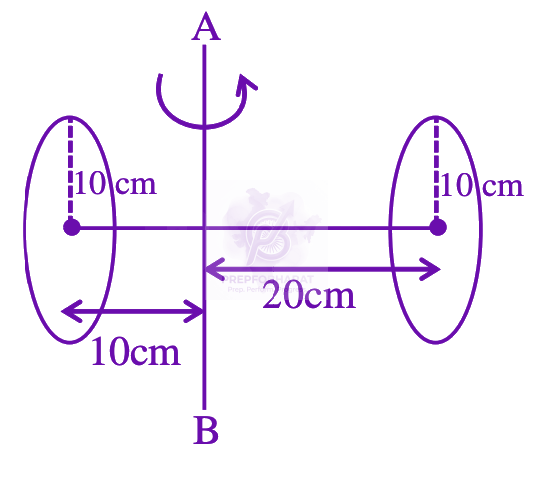
2026medium
Other Physics topics for JEE Main
Keep practicing Mechanics
Work through every JEE Main Mechanics PYQ, year by year.