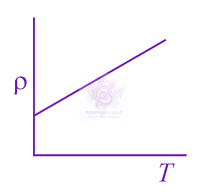
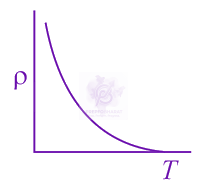
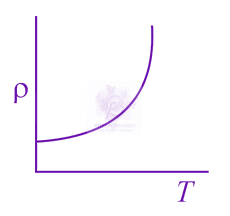
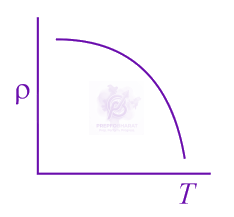
For some metals like copper, resistivity is nearly proportional to temperature although a non linear region always exists at very low temperature. Relation between resistivity and temperature is given by ρ=ρ∘e−aT
Which of the following graph represents the variation of resistivity (ρ ) with temperature (T) for copper?
NEET UG 2020 — Physics Electromagnetism
2020mcqmedium
Which of the following graph represents the variation of resistivity (ρ) with temperature (T) for copper?
Official previous-year question
Held on 30 Apr 2020 · Verified 9 Jul 2026.
Options
- A
- B
- C
- D
Did you get this right?
Sign in to track your attempts and accuracy.
Your note
Sign in to keep a private note on this question. Nothing you write is ever public.
NEET UG Electromagnetism in other years
More NEET UG Electromagnetism questions
Two point charges +2μC and -2μC are placed 10 cm apart. The electric field at the midpoint is:
2026medium
A wire of resistance R is cut into 8 equal pieces. From these pieces two equivalent resistances are made by adding four of these together in parallel. Then these two sets are added in series. The net effective resistance of the combination is :
2025medium
A constant voltage of 50 V is maintained between the points A and B of the circuit shown in the figure. The current through the branch CD of the circuit is :- 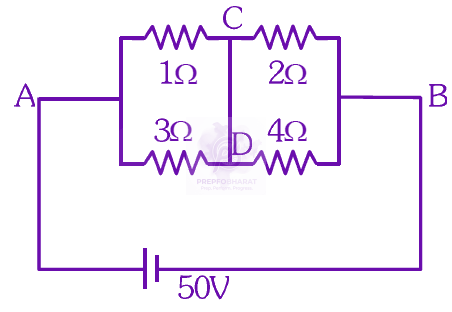
2025medium
A parallel plate capacitor made of circular plates is being charged such that the surface charge density on its plates is increasing at a constant rate with time. The magnetic field arising due to displacement current is :
2025medium
AB is a part of an electrical circuit (see figure). The potential difference " $\mathrm{V}_{\mathrm{A}}-\mathrm{V}_{\mathrm{B}}$ ", at the instant when current $\mathrm{i}=2 \mathrm{~A}$ and is increasing at a rate of $1 \mathrm{amp} / \mathrm{second}$ is : 
2025medium
Other Physics topics for NEET UG
Keep practicing Electromagnetism
Work through every NEET UG Electromagnetism PYQ, year by year.