In a pressure-volume (P−V) graph, the magnitude of work done is represented by the area under the curve bounded by the volume axis.
Let's analyze the area under the curve for each graph:
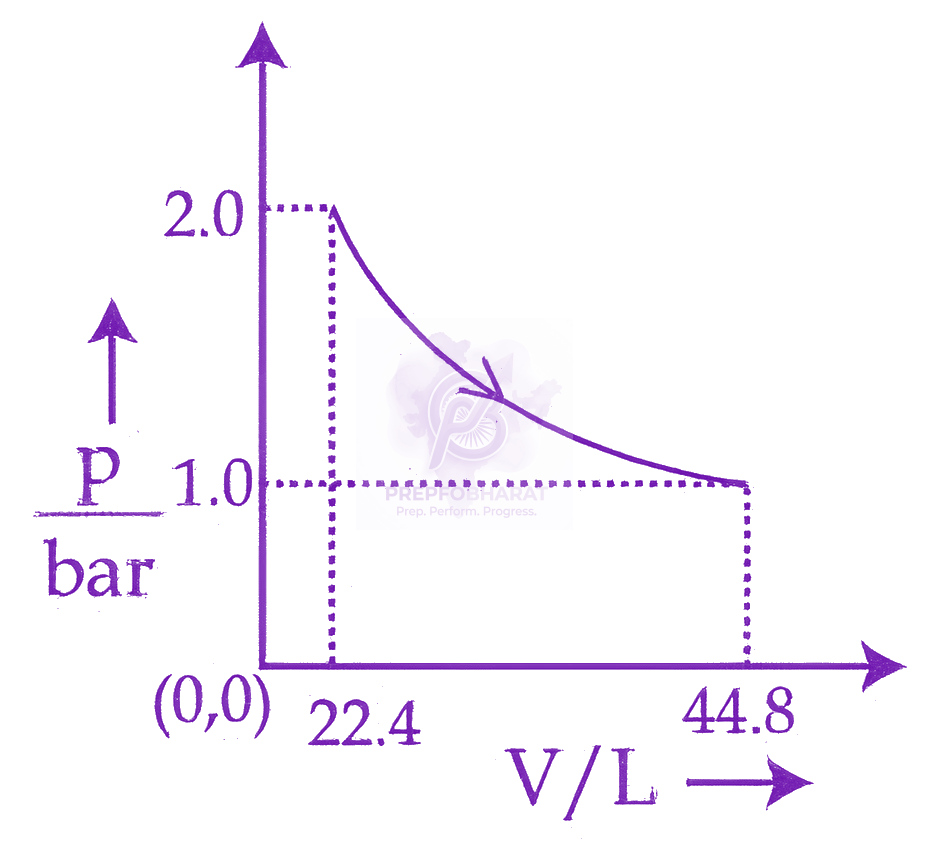
Graph (1) represents an expansion from V=22.4 L to V=44.8 L. The area is the integral ∫22.444.8PdV, which covers a significant region under the curve.
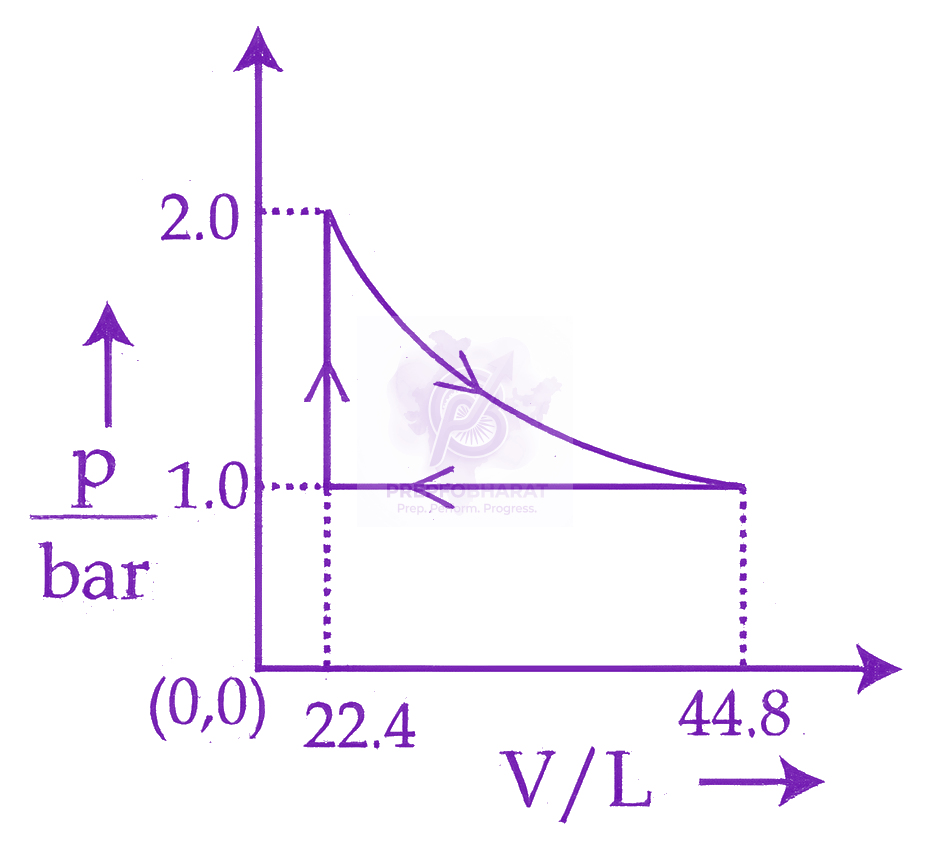
Graph (2) represents a cyclic process. The net work done is the area enclosed by the loop. This area is much smaller than the total area under the expansion curve in graph (1).
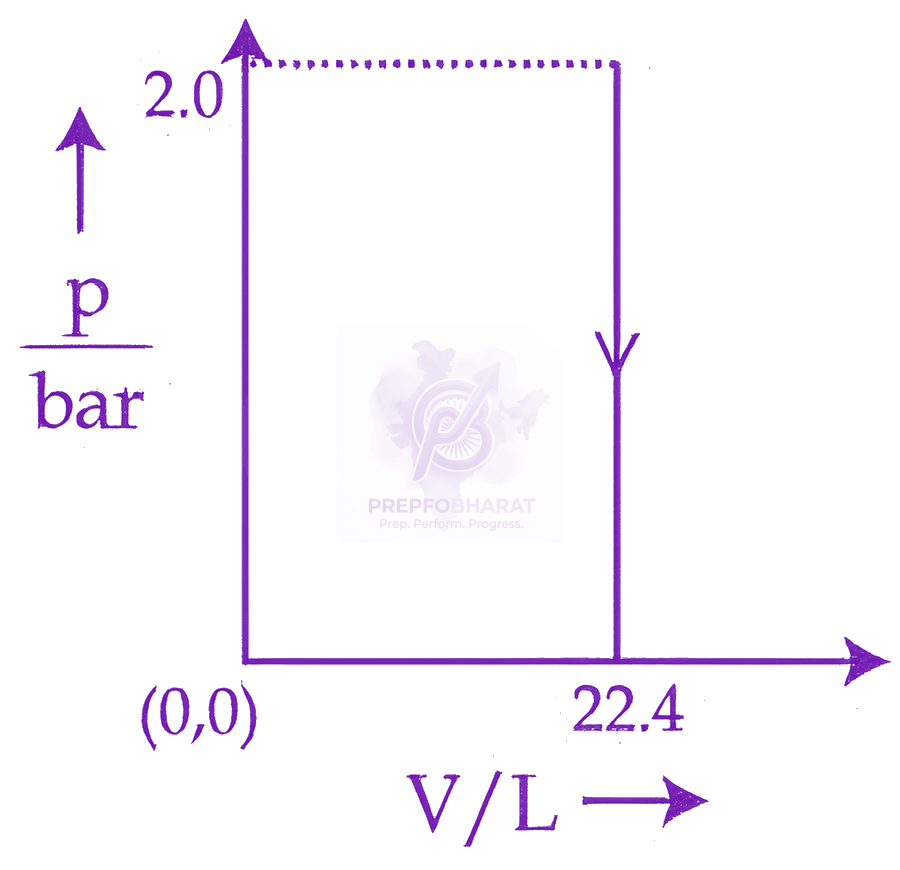
Graph (3) represents an isochoric process (constant volume V=22.4 L). Since dV=0, the work done W=∫PdV=0.
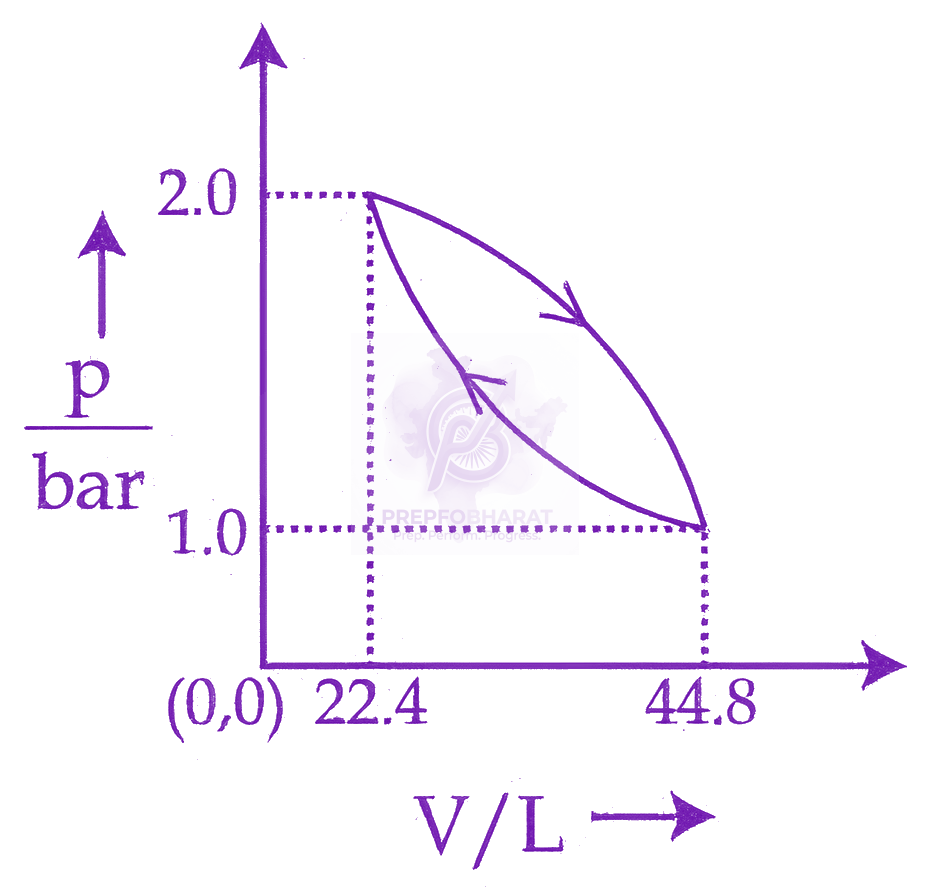
Graph (4) also represents a cyclic process. Similar to graph (2), the net work done is the area enclosed by the loop, which is smaller than the area under the expansion curve in graph (1).
Comparing all cases, the expansion process in graph (1) covers the maximum area under the P−V curve, thus representing the maximum work done.