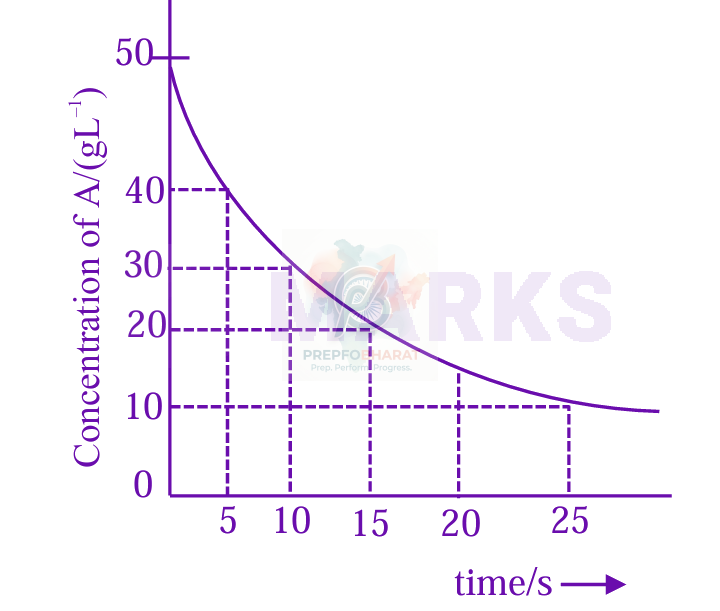
As it is difficult to predict order using data provided in graph.
For specific time interval 0−5sec,5−10sec and 10−15sec. order comes to be zero, but graph is not a straight line.
Assuming 1st order kinetics
$\begin{aligned}
& \mathrm{K}=\frac{1}{\mathrm{t}} \ln \frac{\mathrm{A}_0}{\mathrm{A}_{\mathrm{t}}} \
& \mathrm{~K}=\frac{1}{10} \ln \frac{40}{20}
\end{aligned}$
Time required to reduce to 2.5 g/L
$\begin{aligned}
& \mathrm{K}=\frac{1}{\mathrm{t}} \ln \frac{50}{2.5} \
& \frac{1}{10} \ln 2=\frac{1}{\mathrm{t}} \ln 20 \
& \mathrm{t}=\frac{1.3010 \times 10}{0.3010}=43.3 \mathrm{sec}
\end{aligned}$