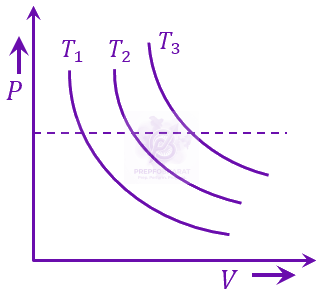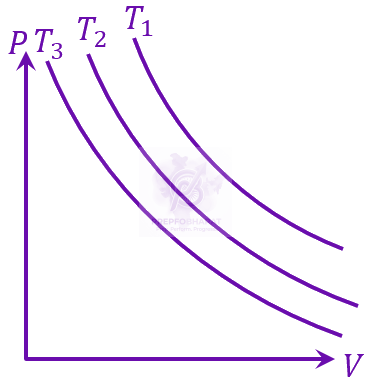
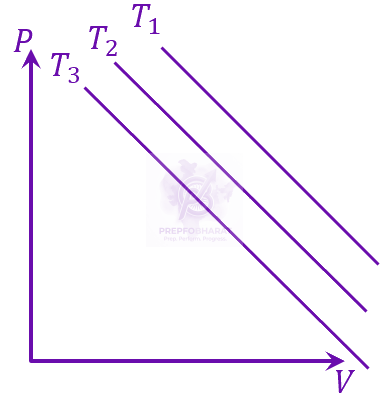
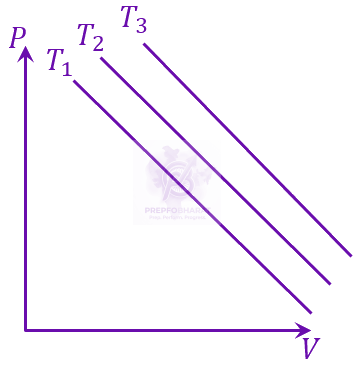
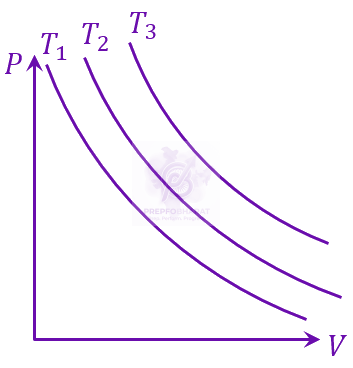
In case of isothermal process, pressure vs volume graph is a rectangular hyperbola.
The graph of the isothermal process shifts away from the origin as the temperature of the process is increased. Thus, the curve away from the origin T3 have the highest temperature whereas the curve closer to the origin T1 have the lowest temperature.
Here, the dotted line shows the isobaric line that implies T3>T2>T1 as T=nRPV.