In a SHM, mechanical energy is conserved. So, the sum of kinetic energy and potential energy remains constant.
For a SHM,
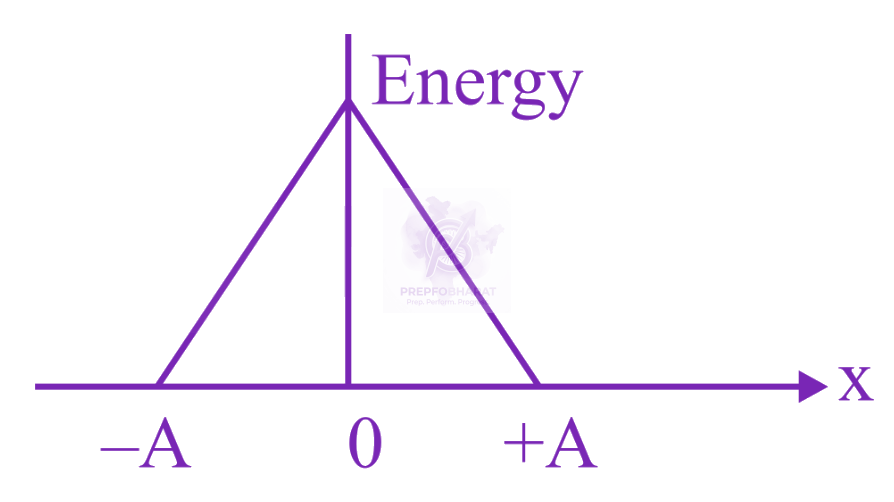
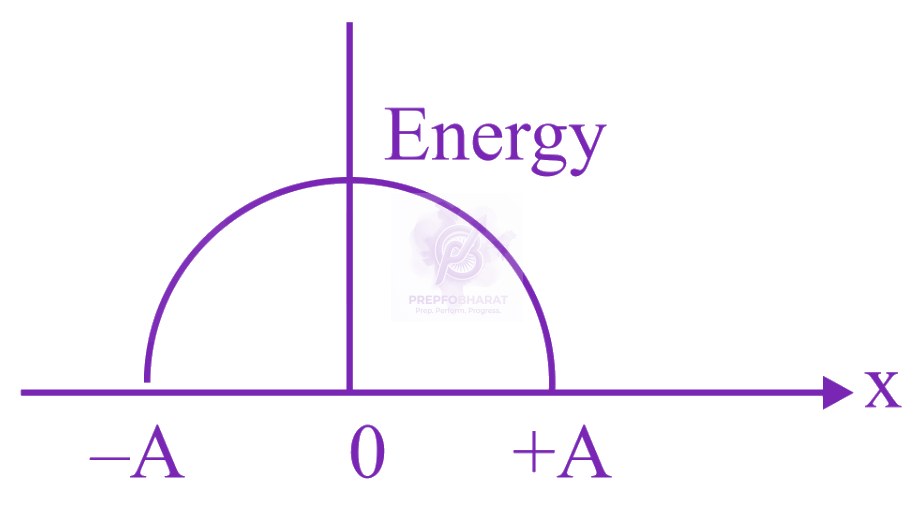
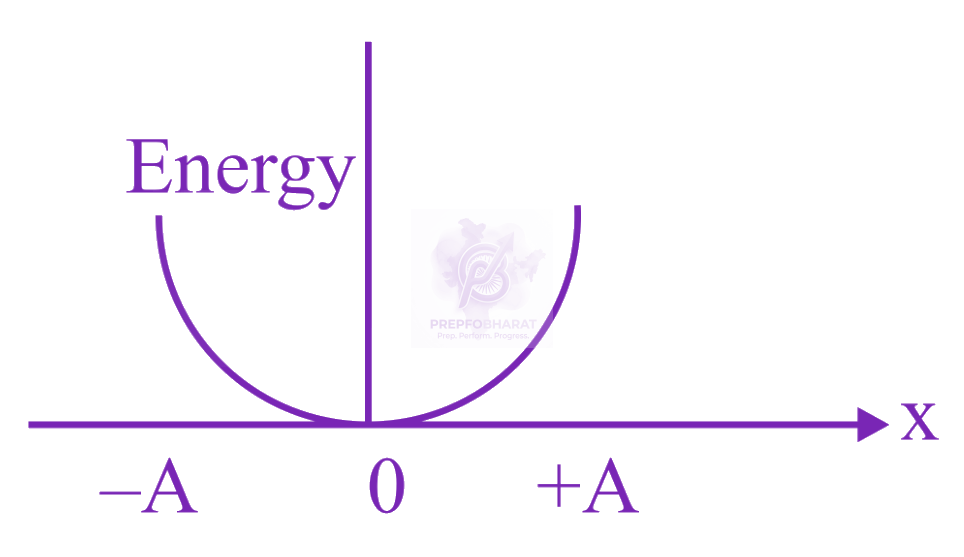
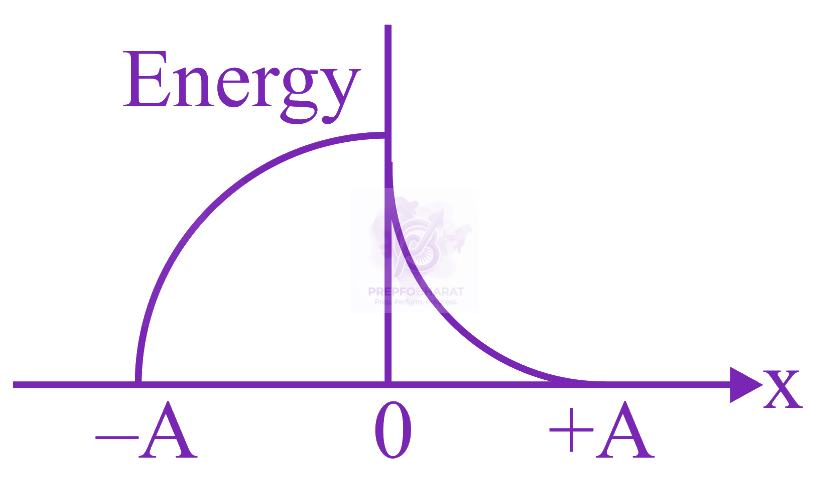
T.E.−U=K.E
⇒T.E.−U=21mv2=21mω2(A2−x2)
This is the equation of a downward parabola.
JEE Main 2023 — Physics Waves & Oscillations
Which graph represents the difference between total energy and potential energy of a particle executing SHM vs its distance from mean position?
Held on 13 Apr 2023 · Verified 6 Jul 2026.
Sign in to track your attempts and accuracy.
Sign in to keep a private note on this question. Nothing you write is ever public.
The time period of a simple harmonic oscillator is $T=2 \pi \sqrt{\frac{k}{m}}$. Measured value of mass $(m)$ of the object is 10 g with an accuracy of 10 mg and time for 50 oscillations of the spring is found to be 60 s using a watch of 2 s resolution. Percentage error in determination of spring constant $(k)$ is $\_\_\_\_$ \%.
Two waves of same frequency and amplitude travel in opposite directions. The resulting pattern is:
A spring-mass system oscillates with angular frequency ω. If the mass is doubled and the spring constant is halved, the new angular frequency is:
In an open organ pipe $\nu_{3}$ and $\nu_{6}$ are $3^{\text {rd }}$ and $6^{\text {th }}$ harmonic frequencies, respectively. If $\nu_{6}-\nu_{3}=2200 \mathrm{~Hz}$ then length of the pipe is $\_\_\_\_$ mm . (Take velocity of sound in air is $330 \mathrm{~m} / \mathrm{s}$.)
A simple pendulum of string length 30 cm performs 20 oscillations in 10 s. The length of the string required for the pendulum to perform 40 oscillations in the same time duration is $\_\_\_\_$ cm. [Assume that the mass of the pendulum remains same.]
Work through every JEE Main Waves & Oscillations PYQ, year by year.