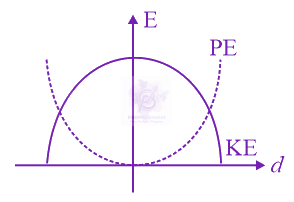
For a simple pendulum, a graph is plotted between its kinetic energy (K.E.) and potential energy (P.E.) against its displacement d. which one of the…
JEE Main 2015 — Physics Waves & Oscillations
2015mcqeasy
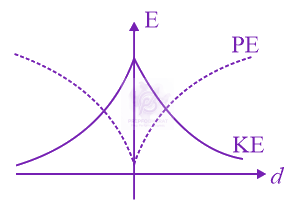
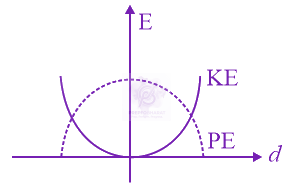
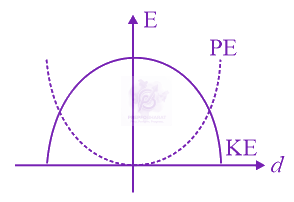
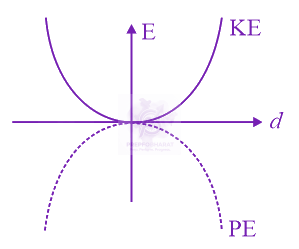
For a simple pendulum, a graph is plotted between its kinetic energy (K.E.) and potential energy (P.E.) against its displacement d. which one of the following represents these correctly? (graphs are schematic and not drawn to scale)
Official previous-year question
Held on 4 Apr 2015 · Verified 6 Jul 2026.
Options
A
B
C
D
Did you get this right?
Sign in to track your attempts and accuracy.
Solution
For simple pendulum performing the simple harmonic motion, displacement, y=Asinωtv=dtdy=ωAcosωt=ωA2−y2⇒K.E.=21mv2,
This represents a downward parabola, Y=±A, K.E.=21ω2m(A2−A2)=0. P.E.=21mω2y2. This represents an upward parabola. On plotting graphs of potential energy & kinetic energy.
Your note
Sign in to keep a private note on this question. Nothing you write is ever public.