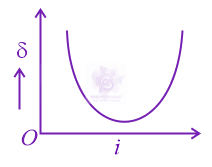
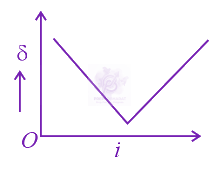
We know that angle of deviation depend upon the angle of incidence. If we determine experimentally the angle of deviation corresponding to different angles of incidence then and then plot i (on x-axis) and δ (on y-axis), we get a curve as shown in figure.
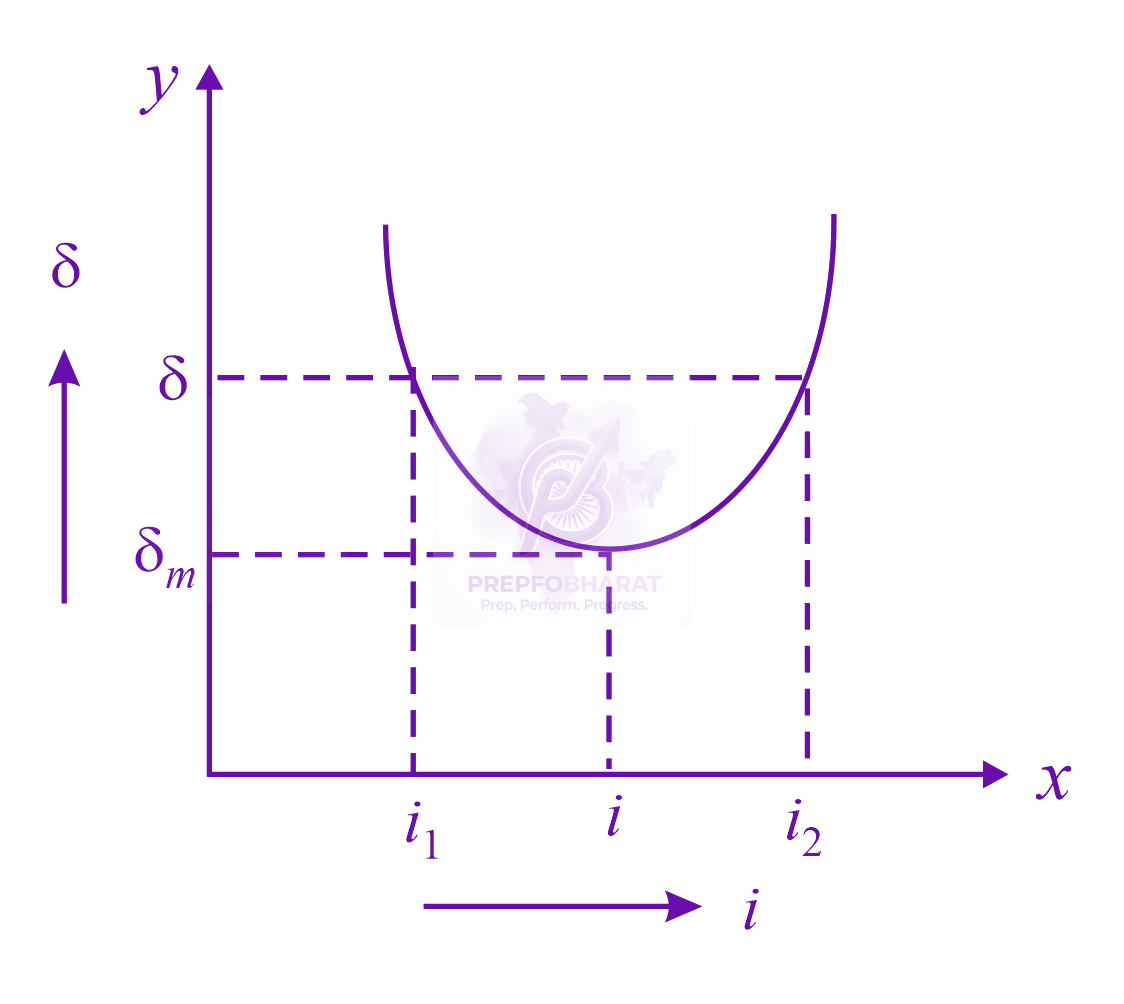
Clearly, if angle of incidence is gradually increased from a small value, the angle of deviation first decreases, becomes minimum for a particular angle of incidence and then begins to increase.