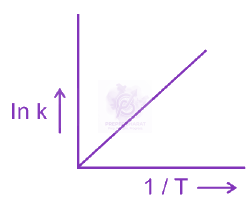
Using Arrhenius equation, k=Ae−Ea/RT k=Ae−Ea/RT lnk=lnA−RTEa y=c+mx, slope (m)=−REa Intercept =lnA 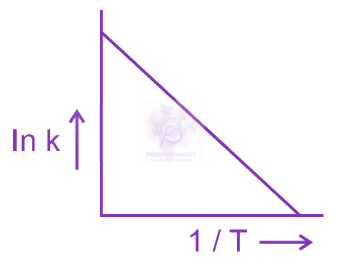
Which of the following plot represents the variation of ln k versus 1 T in accordance with Arrhenius equation?
NEET UG 2024 — Chemistry Physical Chemistry
2024mcqeasy
Which of the following plot represents the variation of lnk versus T1 in accordance with Arrhenius equation?
Official previous-year question
Held on 30 Apr 2024 · Verified 9 Jul 2026.
Options
- A
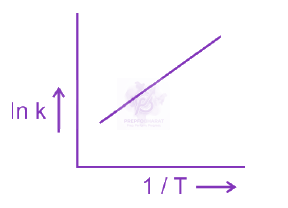
- B
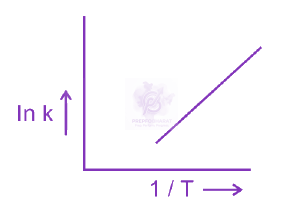
- C
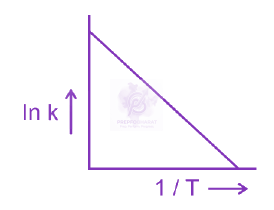
- D
Did you get this right?
Sign in to track your attempts and accuracy.
Your note
Sign in to keep a private note on this question. Nothing you write is ever public.
NEET UG Physical Chemistry in other years
More NEET UG Physical Chemistry questions
For the reaction 2SO₂(g) + O₂(g) ⇌ 2SO₃(g), ΔH = -198 kJ. Which condition favours forward reaction?
2026medium
The unit of rate constant for a first-order reaction is:
2026easy
Among the following choose the ones with equal number of atoms. A. 212 g of $\mathrm{Na}_2 \mathrm{CO}_3(\mathrm{~s})$ [molar mass $=106 \mathrm{~g}$ ] B. 248 g of $\mathrm{Na}_2 \mathrm{O}$ (s) [molar mass $=62 \mathrm{~g}$ ] C. 240 g of $\mathrm{NaOH}(\mathrm{s})$ [molar mass $=40 \mathrm{~g}]$ D. 12 g of $\mathrm{H}_2(\mathrm{~g})$ [molar mass $=2 \mathrm{~g}$ ] E. 220 q of $\mathrm{CO}_2(\mathrm{q})$ [molar mass $\left.=44 \mathrm{~g}\right]$ Choose the correct answer from the options given below:
2025medium
For the reaction $\mathrm{A}(\mathrm{g}) \rightleftharpoons 2 \mathrm{~B}(\mathrm{~g})$, the backward reaction rate constant is higher than the forward reaction rate constant by a factor of 2500 , at 1000 K . [Given : $\mathrm{R}=0.0831 \mathrm{~L} \mathrm{~atm} \mathrm{~mol}^{-1} \mathrm{~K}^{-1}$ ] $\mathrm{K}_{\mathrm{p}}$ for the reaction at 1000 K is
2025medium
The standard heat of formation, in $\mathrm{kcal} / \mathrm{mol}^{\text {of }} \mathrm{Ba}^{2+}$ is : [Given : standard heat of formation of $\mathrm{SO}_4^{2-}$ ion (aq) $=-216 \mathrm{kcal} / \mathrm{mol}$, Standard heat of crystallisation of $\mathrm{BaSO}_4(\mathrm{~s})=-4.5 \mathrm{kcal} / \mathrm{mol}$, standard heat of formation of $\left.\mathrm{BaSO}_4(\mathrm{~s})=-349 \mathrm{kcal} / \mathrm{mol}\right]$
2025medium
Other Chemistry topics for NEET UG
Keep practicing Physical Chemistry
Work through every NEET UG Physical Chemistry PYQ, year by year.