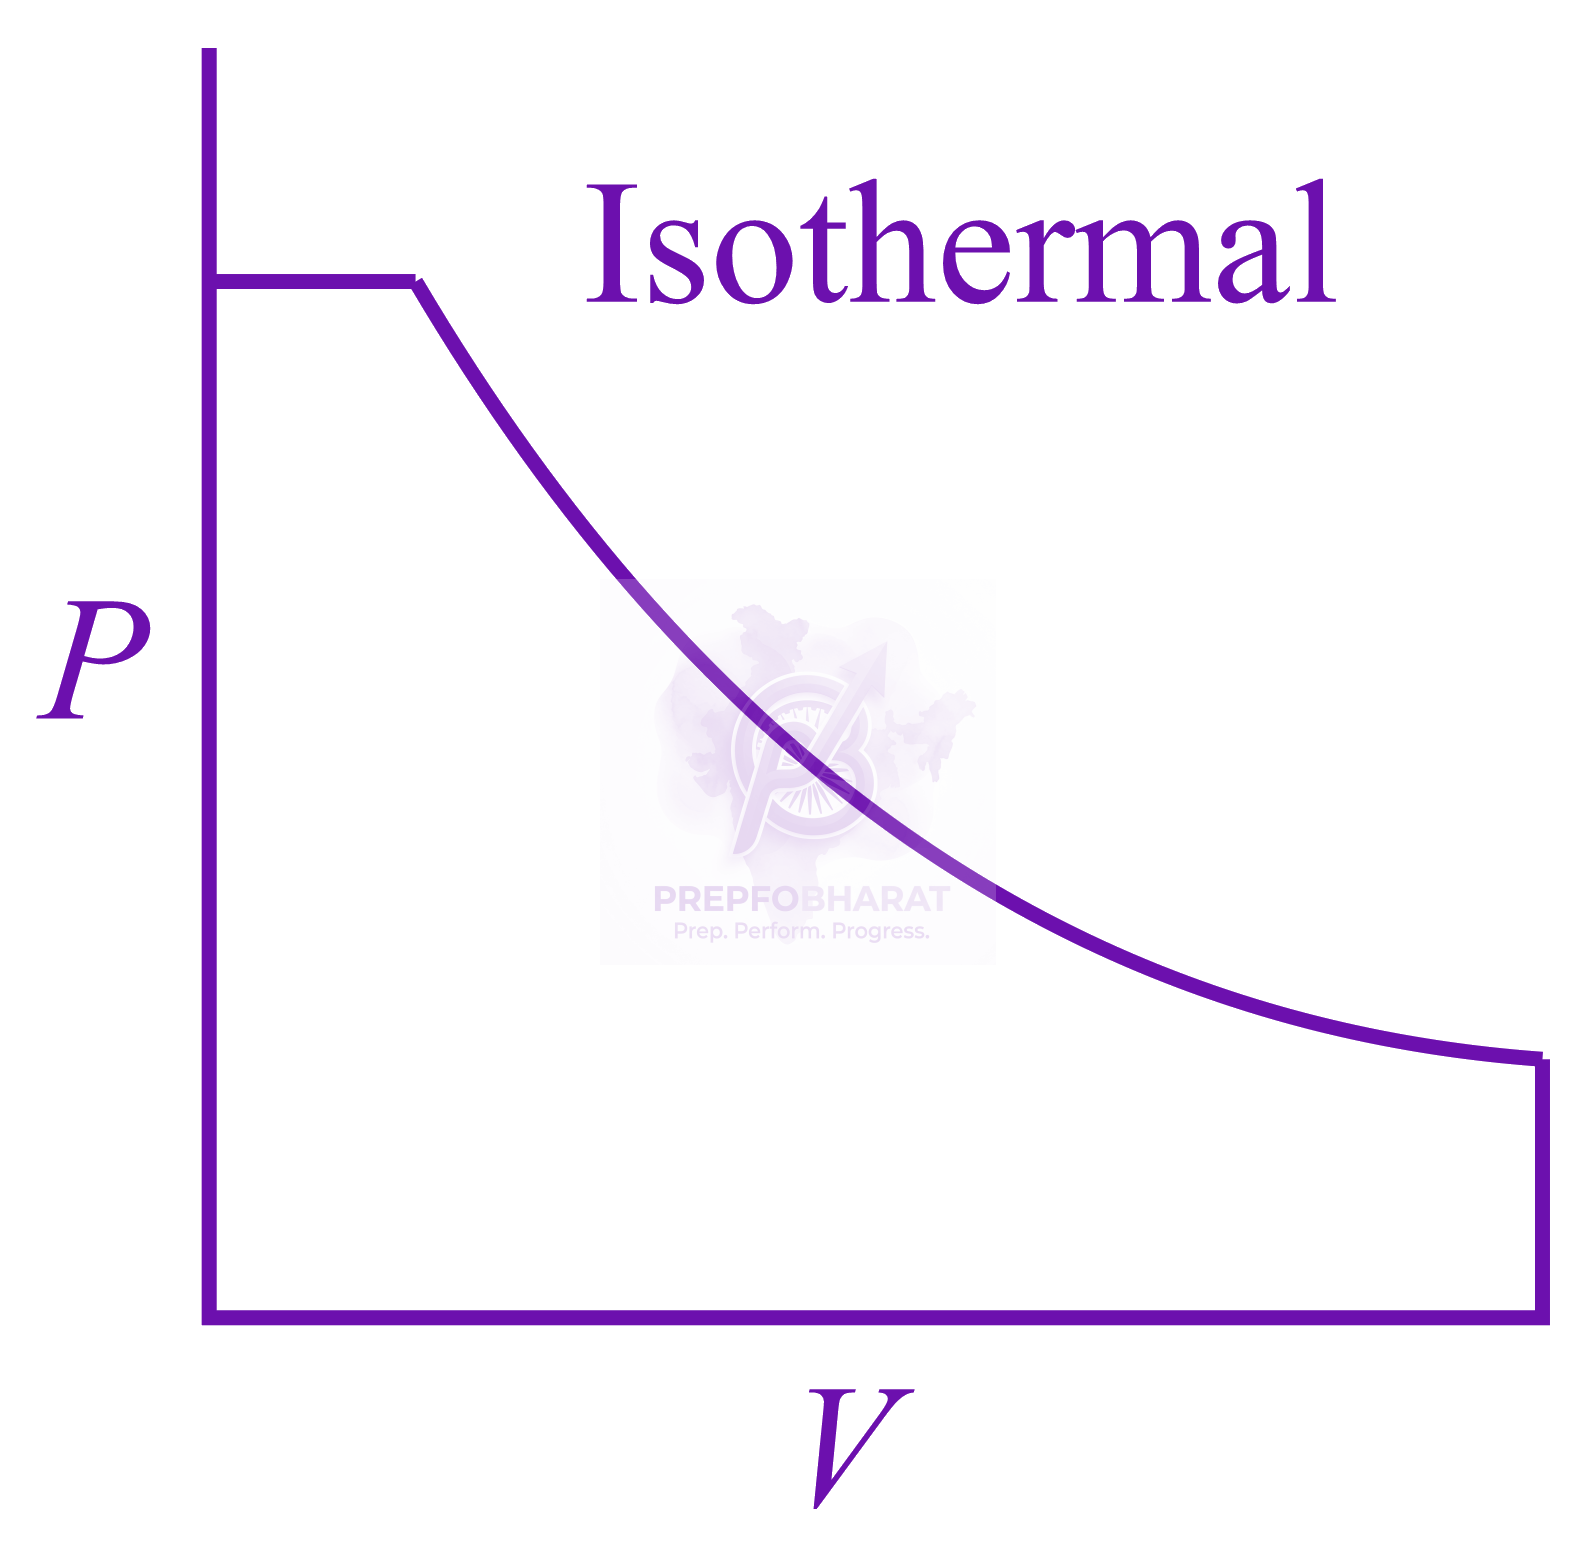
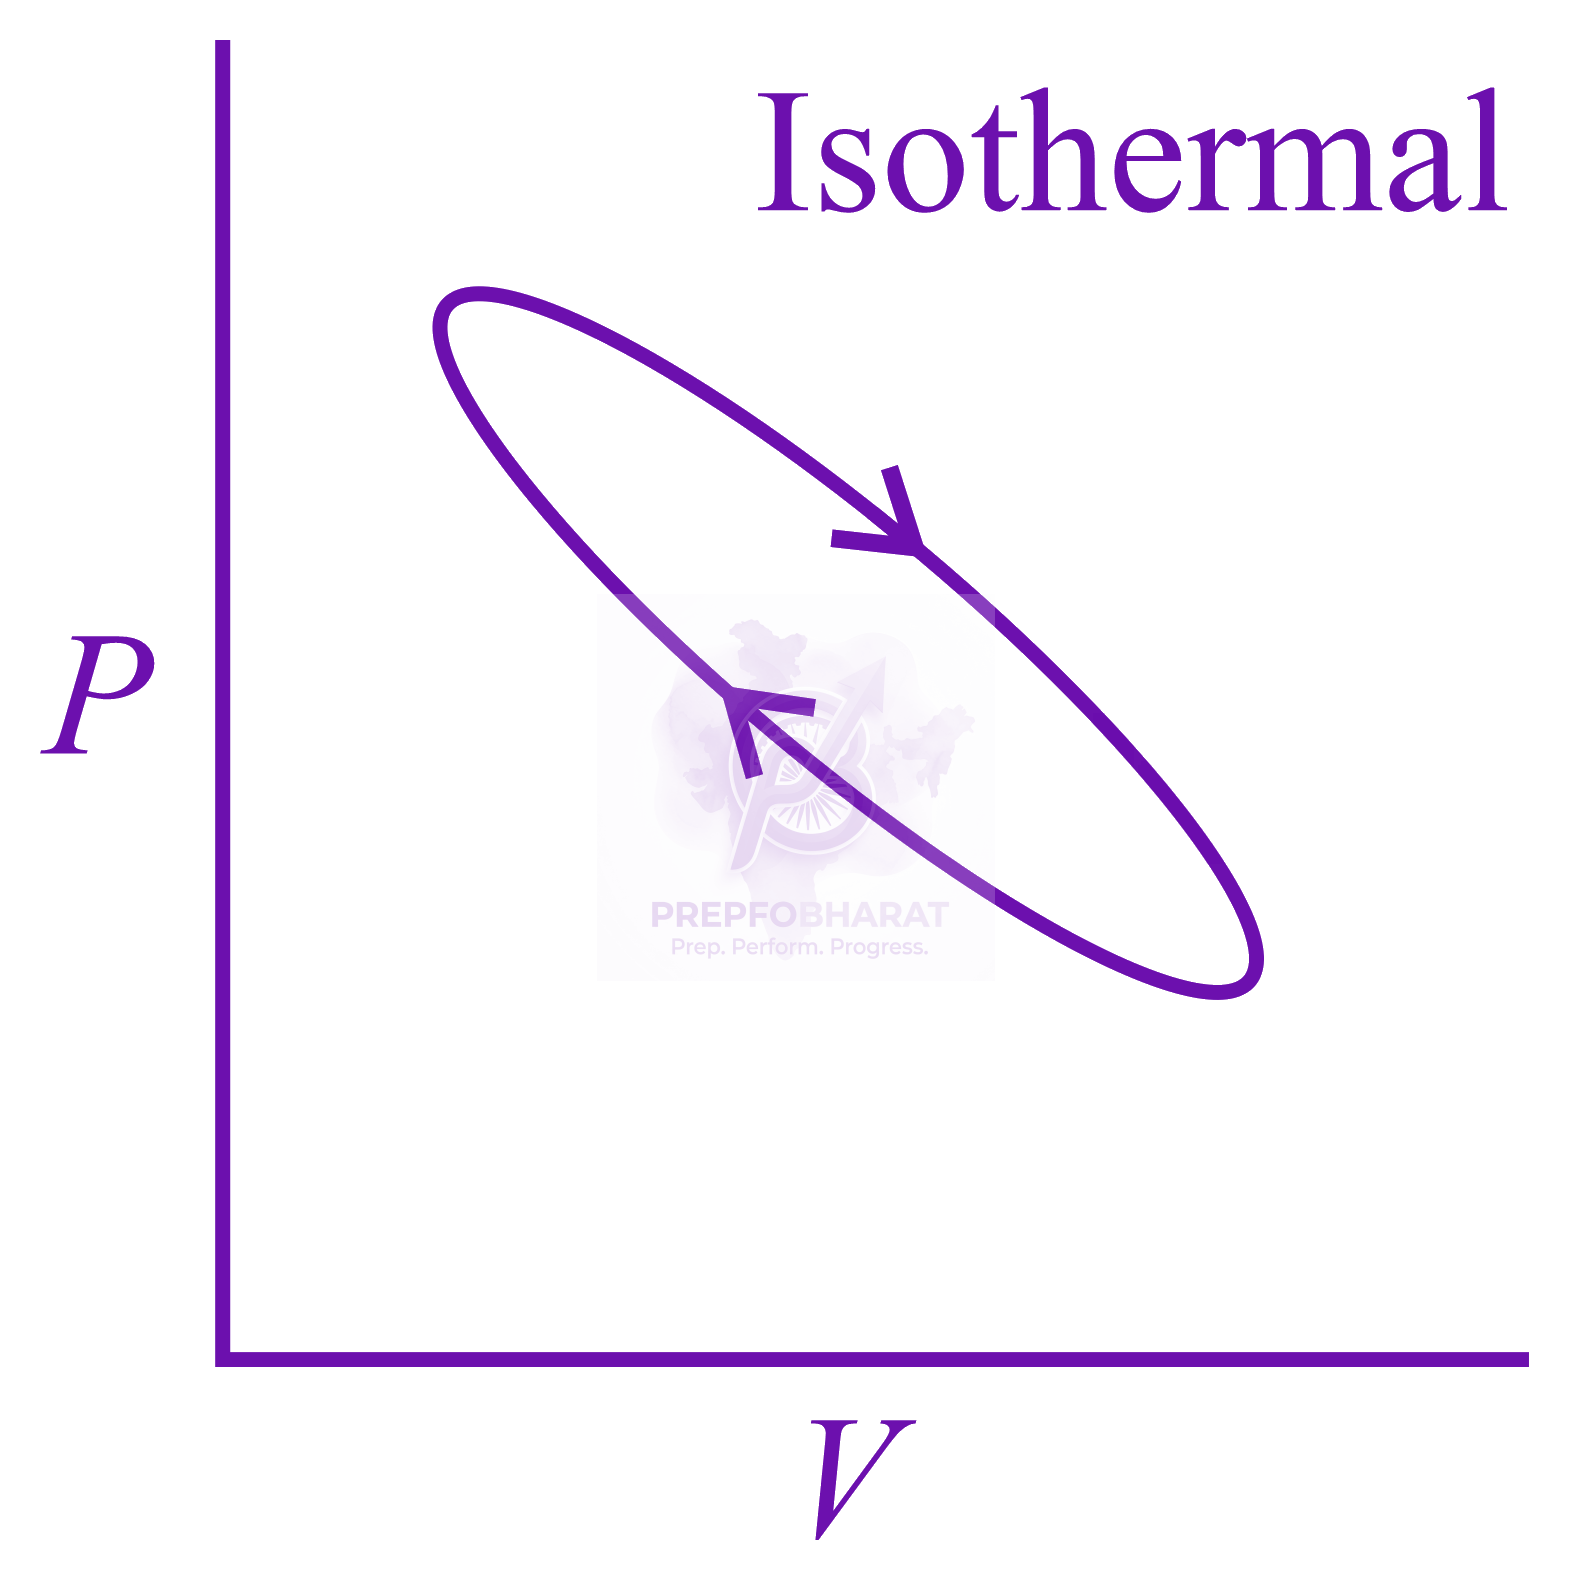
The area under the P−V curve represents the work done. Work can be calculated by calculating area between P-V graph and volume axis. Among the given graphs, the area under the curve is maximum for graph A.
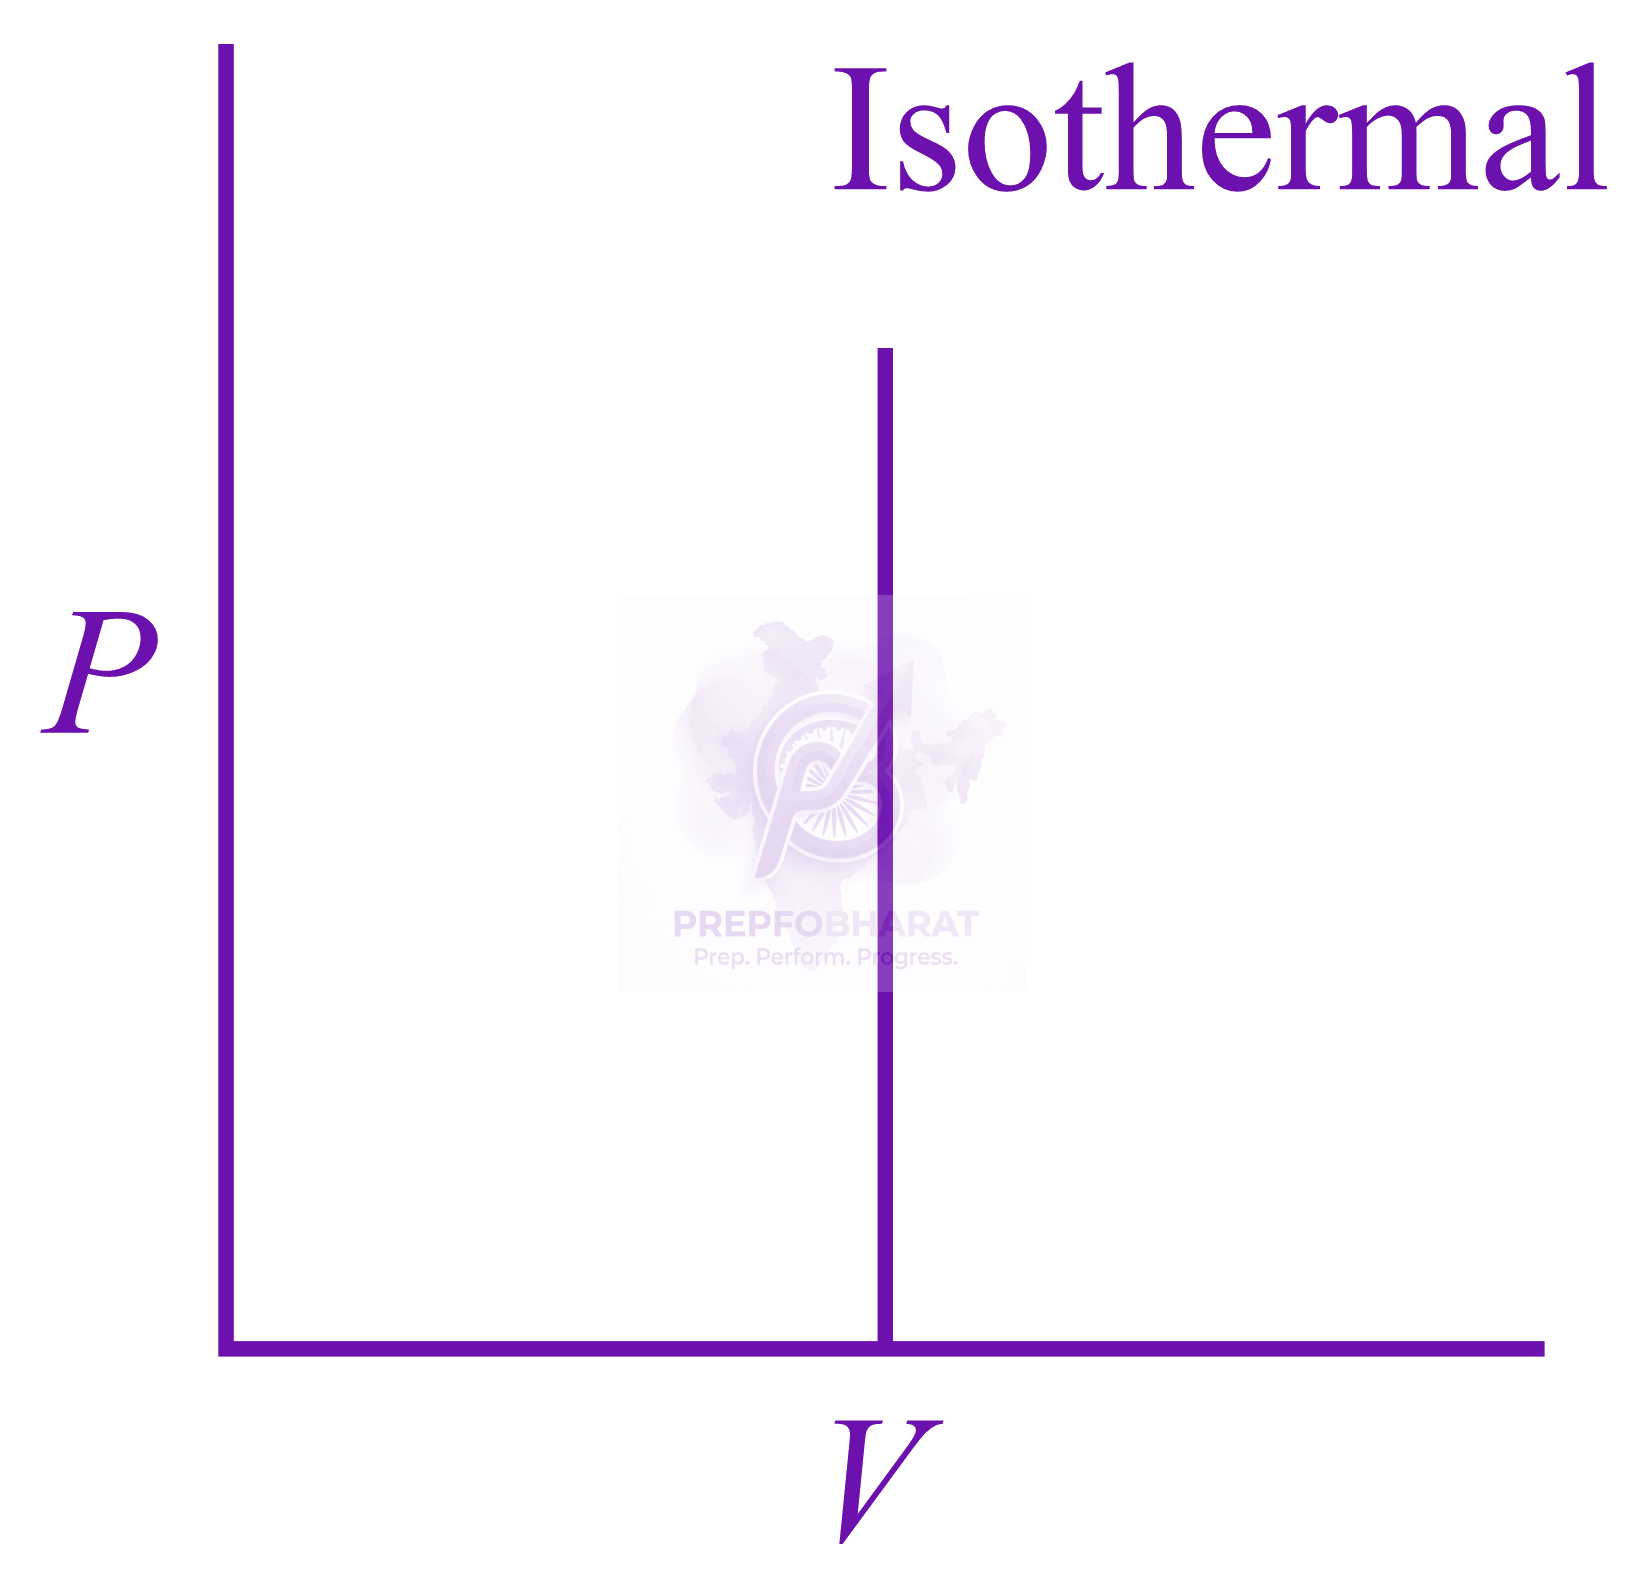
Option B represent isochoric process so, work done will be zero.
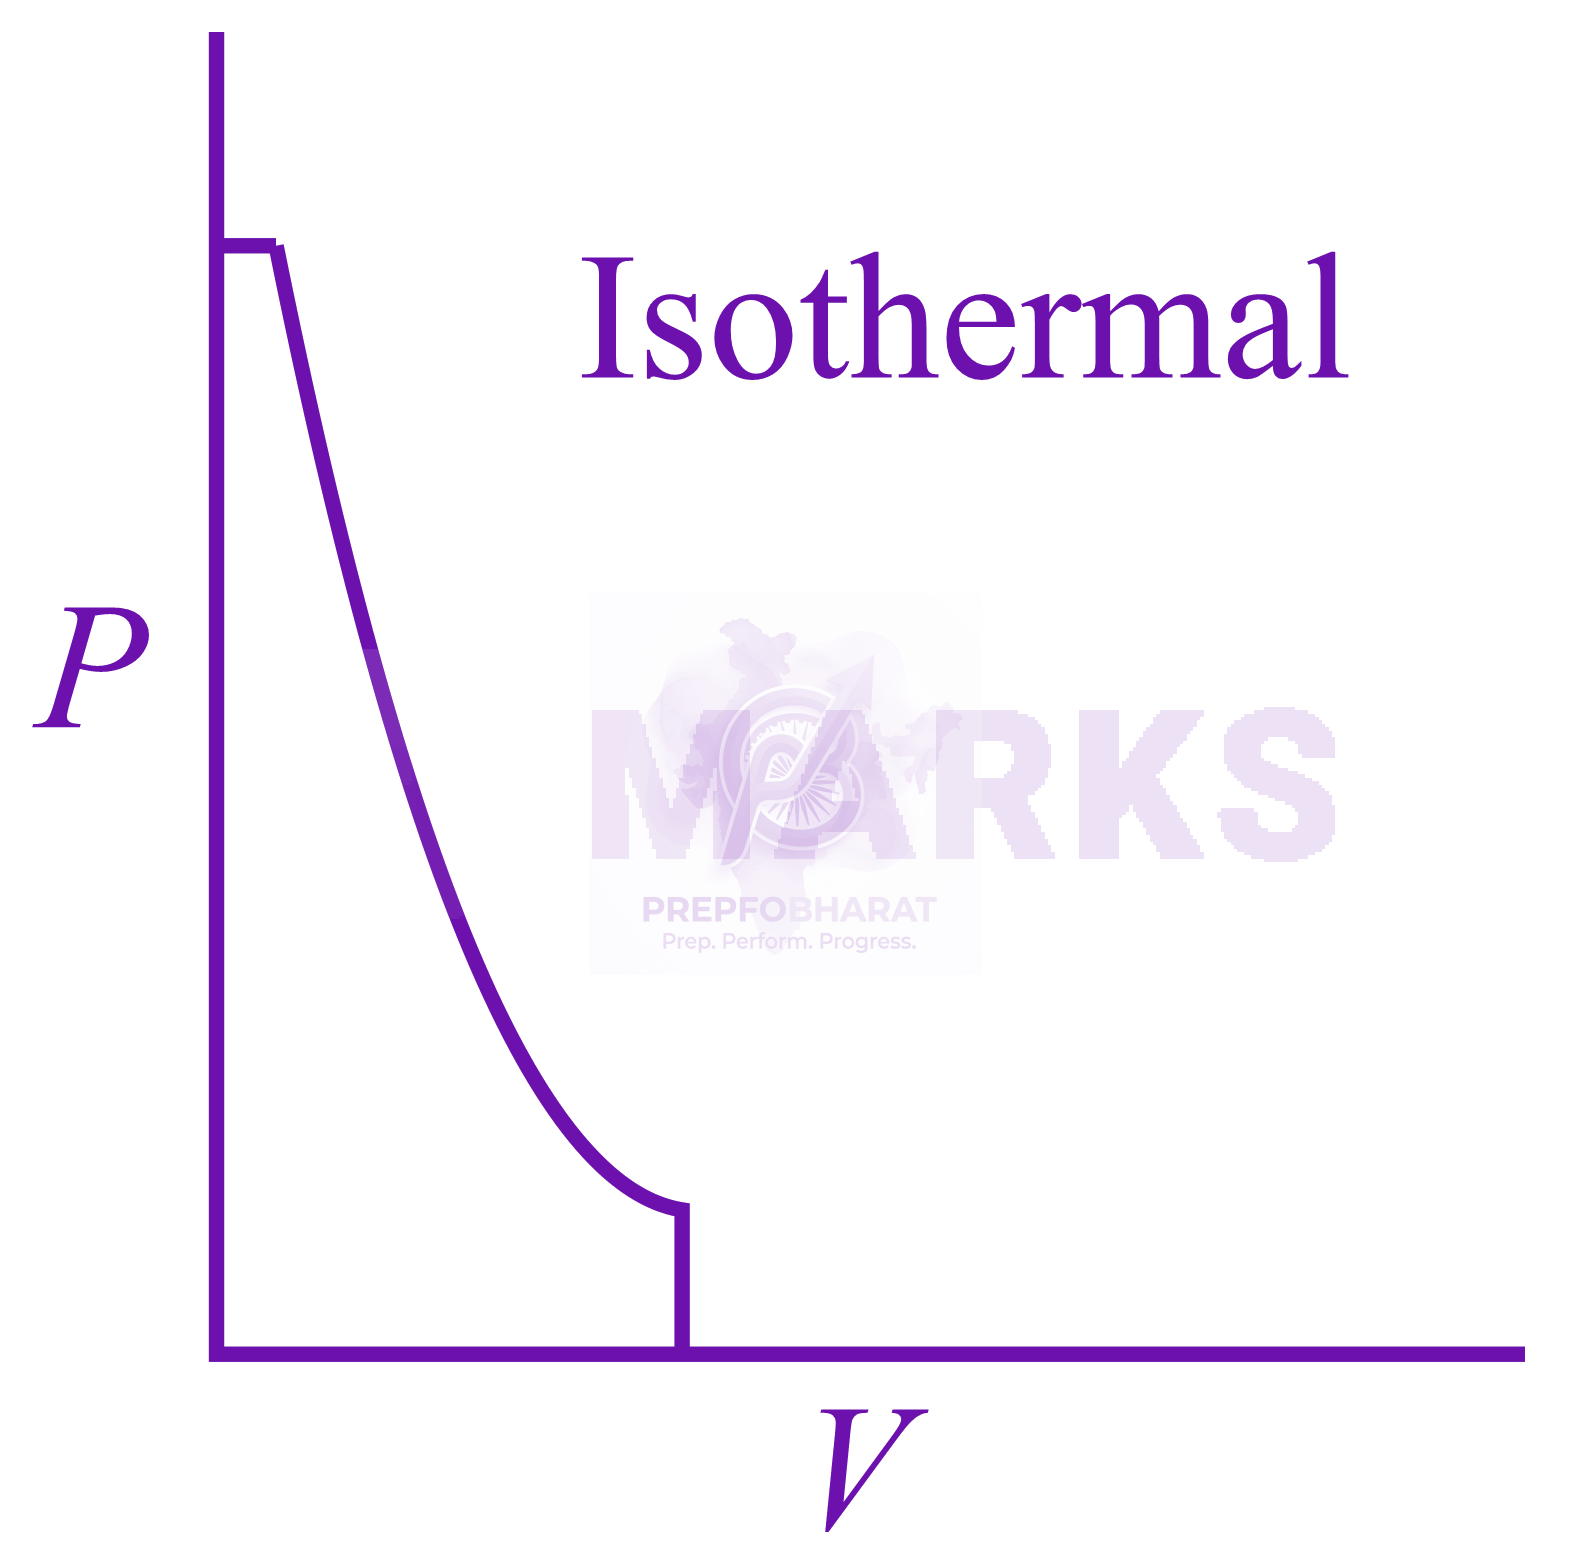
Option C and option D has less area under the curve.