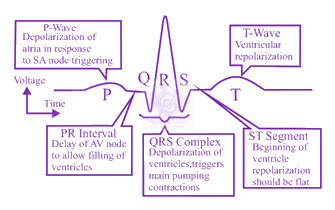
An electrocardiogram (ECG), is a graphical representation of the electrical activity of the heart during a cardiac cycle. The machine used to obtain an electrocardiogram is known as electrocardiography and this technique is called electrocardiography. The interpretation of ECG is as follows:
• The P wave is a small upward wave that represents electrical excitation (or depolarization) of the atria which leads to contraction of both the atria.
• The QRS (wave) complex represents the depolarization of the ventricles, which initiates the ventricular contraction (ventricular systole). The contraction of the ventricles start shortly after Q and marks the beginning of the systole.
• The T wave represents the return of the ventricles from excited (depolarized) to a normal state (i.e., repolarisation). The end of the T wave marks the end of the systole.
• Thus, by counting the number of QRS complexes that occur in a given time period, the heartbeat rate of an individual can be determined.