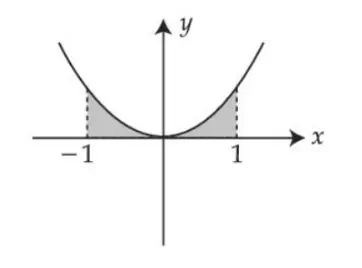
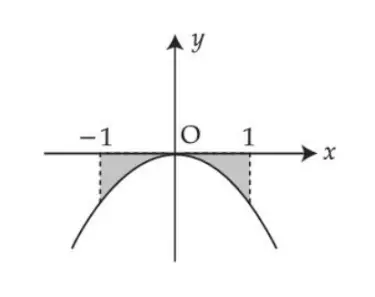
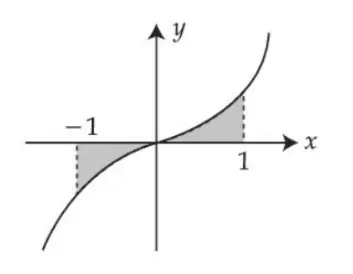
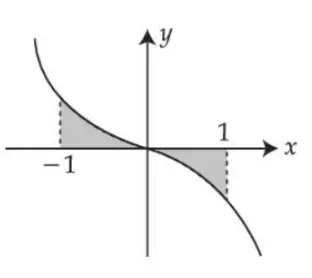
y=x∣x∣=x2 for x≥0 (above x-axis) and y=−x2 for x<0 (below x-axis).
So the curve is in the third quadrant for x<0 and first quadrant for x>0, passing through the origin.
The graph showing this odd-function shape with shading between x=−1 and x=1 matches option 3.
The region bounded by curve y = x|x|, x-axis and lines x = ± 1 is best represented graphically by :
CUET UG 2022 — Mathematics Calculus
2022mcqeasy
The region bounded by curve y=x∣x∣, x-axis and lines x=±1 is best represented graphically by :
Official previous-year question
Held on 7 Aug 2022 · Verified 13 Jul 2026.
Options
- A
- B
- C
- D
Did you get this right?
Sign in to track your attempts and accuracy.
Your note
Sign in to keep a private note on this question. Nothing you write is ever public.
CUET UG Calculus in other years
More CUET UG Calculus questions
The derivative of x³ + 2x² - 5x + 1 is:
2026easy
Match **List-I** with **List-II** | List-I | List-II | |---|---| | **Function** | **Increasing on the interval** | | (A) $f(x) = -x^2 - 2x + 1$ | (I) $(-\infty, -1)$ | | (B) $f(x) = x^2 + 1$ | (II) $(1, \infty)$ | | (C) $f(x) = x^2 - 2x + 3$ | (III) $(-\infty, 0)$ | | (D) $f(x) = -x^2$ | (IV) $(0, \infty)$ | Choose the correct answer from the options given below:
2025medium
For what value of $\alpha$, the function $f$ defined by $f(x) = \begin{cases} \alpha(x^2 - 2x + 1), & \text{if } x \leq 0 \\ 2x + 1, & \text{if } x > 0 \end{cases}$ is continuous at $x = 0$?
2025medium
$\int_0^{\pi/2} \sqrt{1 - \sin 2x}\,dx$ is equal to:
2025medium
The equation of the tangent to the curve $y = \frac{(x - 3)}{(x - 1)(x - 2)}$ at the point, where it cuts x-axis is:
2025medium
Other Mathematics topics for CUET UG
Keep practicing Calculus
Work through every CUET UG Calculus PYQ, year by year.