Correct Option (D)
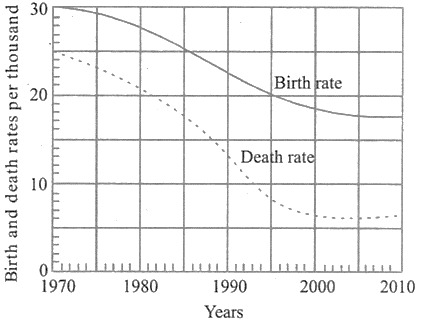
The period from 1990 to 2010 witnessed a decline in both birth rates and death rates, followed by their eventual stabilization. However, when considering the population growth rate, which is the net difference between the birth rate and the death rate, the data indicates an absence of a consistent directional trend (neither a sustained increase nor a sustained decrease) or a stable pattern over this entire duration. The fluctuations resulting from the interplay of declining and stabilizing birth and death rates did not coalesce into a discernible long-term trend for the population growth rate.
Incorrect Options:
Options (A), (B), and (C) are incorrect because they suggest a specific trend (increase, decrease, or stability) in the population growth rate. The demographic data, as interpreted, indicates that the population growth rate did not exhibit a clear and consistent upward, downward, or stable trajectory between 1990 and 2010. Instead, its behavior was characterized by variations that preclude the identification of a definite trend.