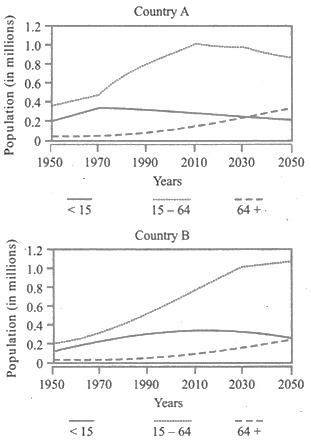
Correct Option (C)
Statements 1 and 3 are the most logical and rational inferences.
- Statement 1: Over the last two and a half decades, the dependency ratio for country B has decreased. A decreasing dependency ratio indicates that the proportion of the working-age population (typically 15-64 years) is growing relative to the dependent population (0-14 years and 65+ years). This trend is characteristic of countries experiencing a demographic dividend, where declining birth rates lead to a larger cohort entering the productive age group, thus reducing the burden of dependents.
- Statement 3: In the next two decades, the work-force relative to its total population will increase in country B compared to country A. This implies that country B is projected to continue its demographic transition, with a growing share of its population entering the working-age group. If country A is further along in its demographic transition, it may be experiencing population aging, where the growth of the elderly dependent population might outpace the growth of the working-age population, or its working-age population might be stabilizing or declining relative to its total population. Consequently, country B's workforce proportion is expected to increase more significantly compared to country A.
Incorrect Options:
- Statement 2: By the end of next two and a half decades, the dependency ratio of country A will be much less than that of country B. This inference is not supported. Given that country B is expected to experience an increase in its workforce relative to its total population (as per statement 3), its dependency ratio is likely to remain low or continue to decline. If country A is experiencing population aging, its dependency ratio could be stable or even increasing due to a larger proportion of elderly dependents. Therefore, it is not logical to conclude that country A's dependency ratio will be significantly lower than country B's. Country B, benefiting from a demographic dividend, may maintain a lower dependency ratio or experience a faster decline in it compared to country A.