Correct Option (3)
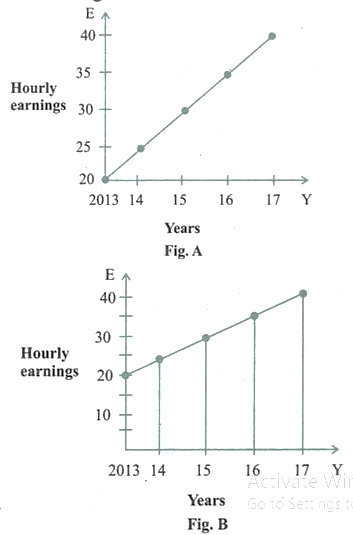
The slopes of the graphs in both representations are identical. The slope of a graph depicting earnings over time directly represents the rate of change or increase in those earnings. Therefore, identical slopes indicate that the rate of increase of average hourly earnings (E) is consistent across both figures.
Incorrect Options:
- Option 1: values of E are different
While the absolute values of E might differ at specific points in time across the two representations due to varying initial conditions or scaling, the primary and most significant observation when the slopes are identical pertains to the consistent rate of change, rather than the absolute differences in values. The identical slopes signify a uniform pattern of change. - Option 2: ranges (i.e., the difference between the maximum and the minimum) of E are different
If the slopes are identical, it implies a consistent rate of change in E. Assuming the representations cover the same duration, an identical rate of change would result in the same total change in E, and thus the same range (difference between maximum and minimum values). Therefore, stating the ranges are different would be inconsistent with identical slopes under similar conditions. - Option 4: rates of increase of E are different
This statement directly contradicts the observation that the slopes of the graphs are the same. The slope of a graph represents the rate of change or increase of the dependent variable (E) with respect to the independent variable (time). Identical slopes inherently mean identical rates of increase.