Correct Option (2)
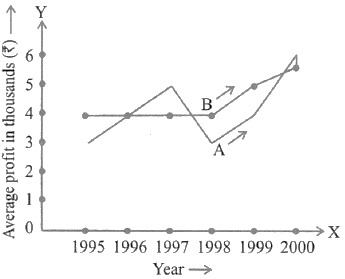
The average profit of fruit-seller B, when observed from 1997 to 2000, demonstrates a consistent pattern where its value either increases or remains constant. This specific trend is accurately described as non-decreasing.
Incorrect Options:
Non-increasing: This term describes a trend where values either decrease or stay the same. It does not align with the observed data for fruit-seller B, which shows no decrease during the specified period.
Steady: A steady trend implies that the profit remained constant without any change. The data for fruit-seller B indicates variations that include increases, thus not being strictly steady.
Fluctuating: This term denotes a pattern involving both increases and decreases in value. As the profit trend for fruit-seller B from 1997 to 2000 is identified as non-decreasing, it precludes any decreases, rendering this option incorrect.