Correct Option
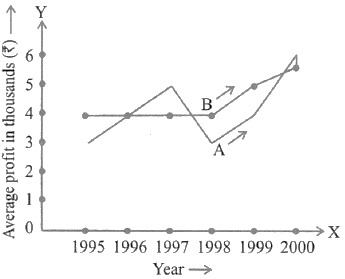
Based on the data presented in the graph:
- The average profit of fruit-seller A in the year 1999 was ₹4,000.
- The average profit of fruit-seller A in the year 2000 was ₹6,000.
To determine how much more average profit A made in 2000 than in 1999, the difference is calculated as follows:
Difference = Average profit in 2000 - Average profit in 1999
Difference = ₹6,000 - ₹4,000 = ₹2,000.
Thus, fruit-seller A made ₹2,000 more average profit in the year 2000 compared to the year 1999.
Incorrect Options
Options 1 (₹200), 2 (₹1,000), and 3 (₹1,500) are incorrect because they do not correspond to the calculated difference of ₹2,000 between the average profits of fruit-seller A in the years 2000 and 1999.