Correct Option (4)
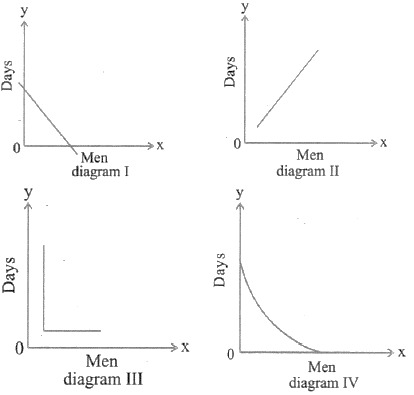
The problem describes a scenario where a fixed amount of work is to be completed. The number of men (x) and the number of days (y) required to complete this work are inversely proportional. This means that as the number of men (x) increases, the number of days (y) required to complete the job decreases, and conversely, if the number of men decreases, the number of days increases. Mathematically, this relationship can be expressed as xy = K, where K is a constant representing the total work. Graphically, an inverse proportionality is represented by a hyperbola in the first quadrant, which approaches the axes asymptotically. Diagram IV accurately depicts this inverse relationship.
Incorrect Options:
Diagram I represents a direct linear relationship, where an increase in x leads to a proportional increase in y. This contradicts the inverse relationship between men and days required for a fixed job.
Diagram II illustrates a constant relationship, meaning y remains unchanged regardless of the value of x. This does not reflect the dependency of days on the number of men for completing a task.
Diagram III represents a direct relationship, where y increases as x increases. This is inconsistent with the inverse proportionality required, where an increase in men should lead to a decrease in days.