From the graph, the break-even point is identified where revenue equals cost, and fixed cost is the y-intercept of the cost line. Per the answer key, the break-even point is at x=6 and fixed cost is 20, so options (C) and (D) are correct.
Which of the following are true for the given graph. (A) Break even point is at x = 10 (B) Break even point is at x = 8 (C) Break even point is at x…
CUET UG 2022 — Mathematics Applied-Mathematics
2022mcqmedium
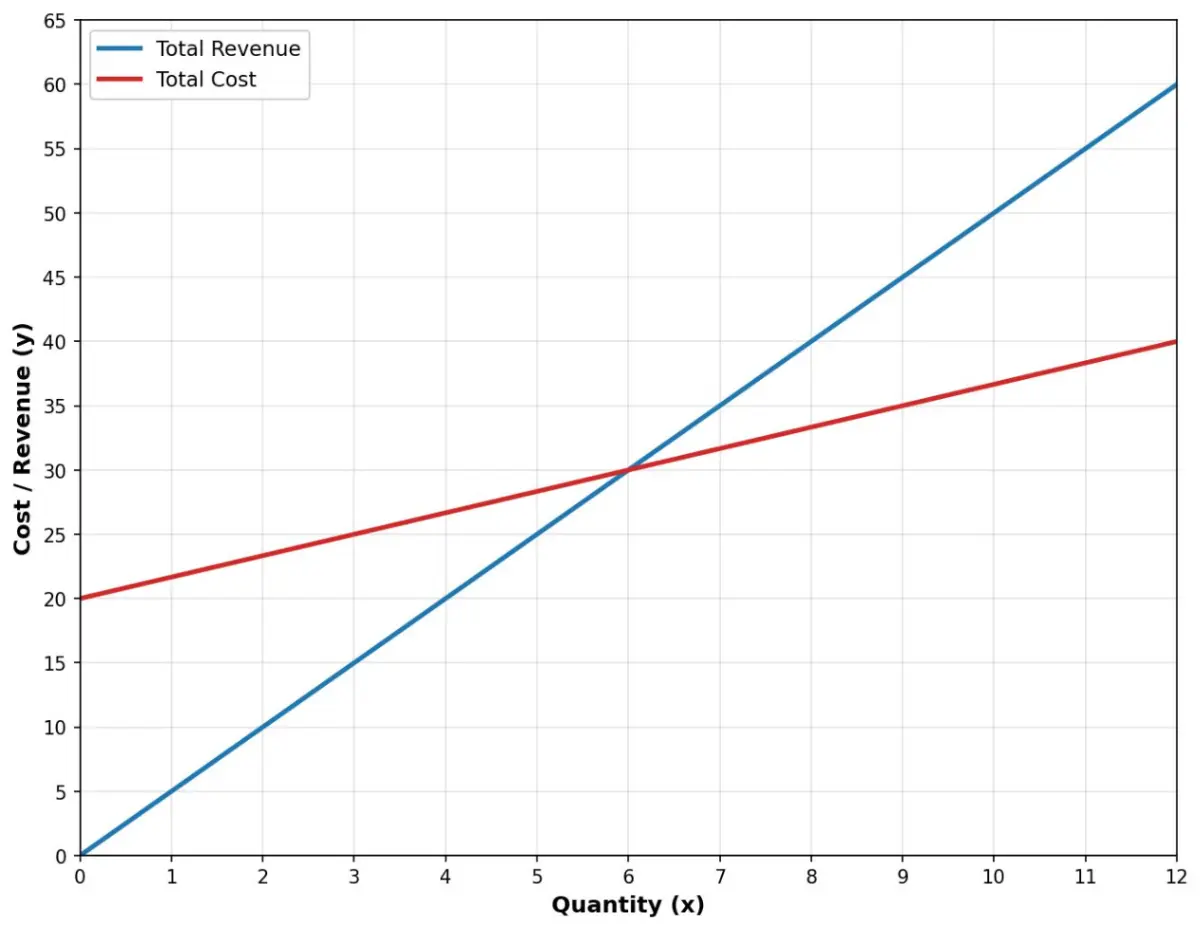 Which of the following are true for the given graph.
(A) Break even point is at x = 10
(B) Break even point is at x = 8
(C) Break even point is at x = 6
(D) Fixed cost is 20
(E) Fixed cost is 0
Choose the correct answer from the options :
Official previous-year question
Held on 11 Aug 2022 · Verified 13 Jul 2026.
Options
- A
(A) and (E) only
- B
(B) and (E) only
- C
(C) and (D) only
- D
(B) and (D) only
Did you get this right?
Sign in to track your attempts and accuracy.
Your note
Sign in to keep a private note on this question. Nothing you write is ever public.
CUET UG Applied-Mathematics in other years
More CUET UG Applied-Mathematics questions
If $y = e^{\frac{1}{2}\log(1+ \tan^2 x)}$, then $\frac{d^2y}{dx^2}$ is equal to:
2025medium
If the total cost and total revenue of a company that produces and sells $x$ units of a particular product are $C(x) = 5x + 350$ and $R(x) = 50x - x^2$ respectively, then which of the following is/are the breakeven values: (A) $x = 10$ (B) $x = 25$ (C) $x = 45$ (D) $x = 30$ Choose the correct answer from the options given below:
2025medium
The supply function of a commodity is P = $x^3+2x+18$. When 4 units of commodity are sold , then producer surplus is:
2025medium
If the random variable X follows the Poisson distribution such that P[X = k] = P[X = k+1], then the mean value of X is:
2025medium
The demand function P for maximising a profit monopolist is given by P=274-x², while the marginal cost is 4+3x for x units of commodity. The consumer surplus is
2025hard
Other Mathematics topics for CUET UG
Keep practicing Applied-Mathematics
Work through every CUET UG Applied-Mathematics PYQ, year by year.