Option 1 -> This rectangle likely represents Total Cost (TC = AC × Q), not Total Variable Cost.
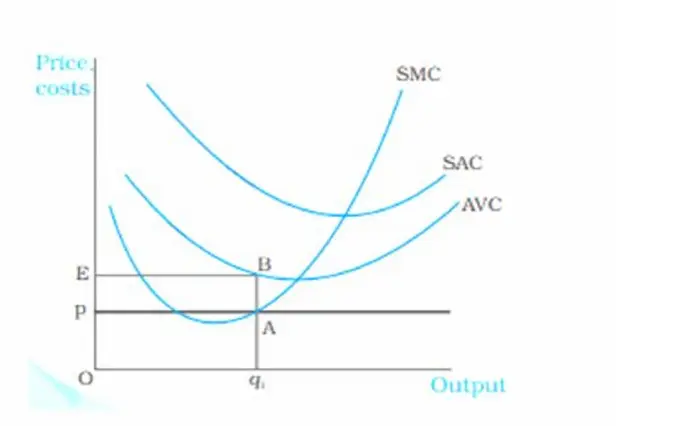
Option 2 -> This rectangle represents Total Variable Cost where height EB is the Average Variable Cost (AVC) at output q₁, and width is q₁. TVC = AVC × Q = Area OEBq₁.
Option 3 -> This difference would represent Total Fixed Cost (TFC = TC - TVC), not Total Variable Cost.
Option 4 -> tan Θ represents a slope/ratio, not a total cost measure.
Hence, Option 2: The area of rectangle OEBq₁ -> Total Variable Cost (TVC) is calculated as Average Variable Cost (AVC) multiplied by the quantity produced. In the diagram, point B lies on the AVC curve at output q₁, where EB represents the AVC at that output level. The rectangle OEBq₁ has width q₁ and height EB (AVC), so its area equals AVC × q₁, which is the Total Variable Cost at output q₁. -> correct