Option 4: OL -> In demand aggregation diagrams, the aggregate demand function is obtained by horizontally summing individual demand curves. The aggregate quantity demanded at any given price level is measured from the origin (O) to the point representing total demand (L). OL represents the complete aggregate demand, showing the total market demand from the starting point (origin O) to the final aggregate point (L). -> correct
From the following figure, how to obtain an aggregate demand function?
CUET UG 2025 — Economics Macro
2025mcqmedium
From the following figure, how to obtain an aggregate demand function?
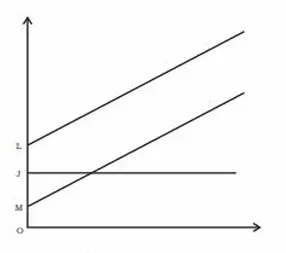
Official previous-year question
Held on 31 May 2025 · Verified 13 Jul 2026.
Options
- A
OM
- B
JM
- C
LM
- D
OL
Did you get this right?
Sign in to track your attempts and accuracy.
Your note
Sign in to keep a private note on this question. Nothing you write is ever public.
CUET UG Macro in other years
More CUET UG Macro questions
Arrange the following chronologically: (A) Great Depression. (B) The Economic Consequences of the Peace. (C) An Enquiry into the Nature and cause of the Wealth of the Nations. (D) The General Theory of Employment, Interest and Money. Choose the correct answer from the options given below:
2025medium
Match List-I with List-II | List-I | List-II | |---|---| | (A) C + I + G + (X-M) + NFIA | (I) $GDP_{MP}$ | | (B) $GDP_{MP}$ - Depreciation | (II) Domestic Income | | (C) NDP MP - IT + Subsidies | (III) $NDP_{MP}$ | | (D) $NDP_{MP}$ + Depreciation | (IV) $GNP_{MP}$ | Choose the correct answer from the options given below:
2025medium
Match List-I with List-II | List-I | List-II | |---|---| | (A) Net National Product at Market Prices (NNP_MP) | (I) GNP_MP - Net Product Taxes - Net Production Taxes | | (B) Gross National Product at Market Prices (GNP_MP) | (II) GDP at market prices | | (C) Gross National Product at Factor Cost (GNP_FC) | (III) GNP_MP - Depreciation | | (D) GVA at Market Prices | (IV) GDP_MP + NFIA | Choose the correct answer from the options given below:
2025hard
The change in the inventory of a firm is treated as an investment. What are the major categories of investment? (A) Investment Expenditure. (B) Autonomous Investment. (C) Fixed Business Investment. (D) Residential Investment. Choose the correct answer from the options given below:
2025medium
Match List-I with List-II | List-I | List-II | |---|---| | (A). M1 | (I). Currency held by the public and net demand deposits held by commercial banks | | (B). M2 | (II). M3 + Total deposits with Post Office savings organisations | | (C). M3 | (III). M1 + Net time deposits of commercial banks | | (D). M4 | (IV). M1 + Savings deposits with Post Office savings banks | Choose the correct answer from the options given below:
2025medium
Other Economics topics for CUET UG
Keep practicing Macro
Work through every CUET UG Macro PYQ, year by year.